


The London markets retreated today (as on 18th June 2020, before the market close) as a spike in COVID-19 cases in US and China raised apprehensions for the second wave of infection. Adjacently, FTSE 100 extended losses and was trading around 6,201.03 (before the market close at 12.59 PM GMT), down by 0.84 per cent against the previous day closing.
The major triggers trending in today’s trading session were:
- The Bank of England (BOE) kept the bank rate unchanged at 0.1 per cent, while market experts were anticipating it to be in negative territory.
- The BOE added GBP 100 billion to the stimulus by increasing its bond-buying to steer the economy from coronavirus induced slump.
- Yesterday, the inflation rate in the UK fell lowest from July 2016 to 0.5 per cent in May from 0.8 per cent in April.
Considering the above sentiments in mind, we are going to analyse two LSE listed stocks operating in the Electricity sector - SSE PLC (LON:SSE) and ContourGlobal PLC (LON:GLO). As on 18th June 2020 (before the market close at 1.28 PM GMT+1), SSE gained over 1.05 per cent, while GLO’s price surged around 0.65 per cent. Yesterday, SSE PLC released its preliminary results for FY20. Let us walk through the financial and operational position of both the Companies to infer the stock price movements better.
SSE PLC (LON:SSE) – Kickstarting a Green Economic Recovery with Wiking Wind Farm
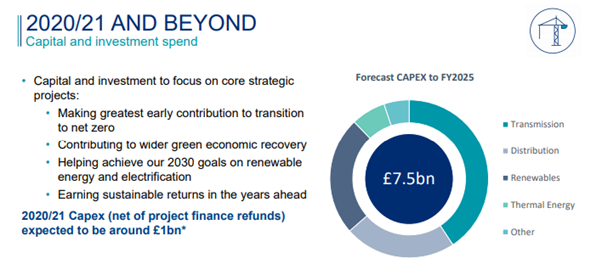
SSE PLC is a FTSE 100 Utility Company, which is engaged in generating, producing, distributing, and supplying gas and electricity along with other energy associated services across the United Kingdom and Ireland. The Company has three prominent areas, namely Network, Retail and Wholesale. In its FY20 preliminary results, the Company unveiled its plan to invest more than GBP 7 billion to support net-zero carbon emission to drive green economic recovery.
On 9th July 2020, the Company is expected to release its annual report for FY20, and on 12th August 2020, the Company will hold its annual general meeting.
(Source: Presentation, Company Website)
Recent Significant Developments of 2020
17th June 2020: The Company is moving towards a green economic recovery post lockdown as it has approved a final decision regarding the investment in 443MW Viking onshore wind farm with 103-turbines. The expected capital expenditure on the wind farm is GBP 580 million.
3rd June 2020: The Company announced the disposal of 51 per cent stake in Seagreen 1 offshore wind farm project for a consideration of GBP 70 million. However, it will continue the development of the project and estimating the completion in 2022 to 2023.
Financial Highlights – Shown Solid Recovery from Prior Year and Completed Energy Service Sale
On 17th June 2020, the Company provided the preliminary results for the year ended 31st March 2020, with a fall in full-year profit on exceptional charges and success in CfD (Contracts for Difference) auctions and quality RIIO (Revenue = Incentives + Innovation + Outputs) T2 business plan. However, it continues to target delivery of its five-year 2018/19 to 2022/23 dividend plan. Additional Highlights of FY20, which reflect decent performance:
- Revenue slipped to GBP 6,800.6 million in FY20 from GBP 7,301.5 million in FY19.
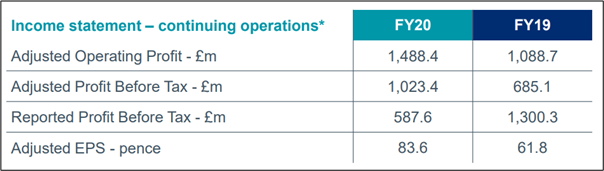
- Despite negative coronavirus impact of GBP 18.2 million related to electricity demand, the adjusted operating profit surged by 37.0 per cent to GBP 1,488.4 million, while its reported operating profit was down to GBP 963.4 million.
- A reported pre-tax profit on continuing operations of GBP 587.6 million in FY20 as compared to a reported profit on continuing operations of GBP 1,300.3 million in the previous year. Thus, its adjusted pre-tax profit augmented by 49 per cent to GBP 1,023.4 million.
- Final dividend per share of 56 pence recommended for payment on September 18, 2020, representing a full-year dividend per share of 80 pence, with vital income for pensions and savings.
(Source: Presentation, Company Website)
Balance Sheet and Other Highlights
- Total generation output decreased to 28,293 gigawatt-hours against the same period last year, with the thermal generation of 17,725 gigawatt-hours.
- SSE’s total regulatory asset value (RAV) ended 31st March 2020 at GBP 9,106 million from GBP 8,729 million the year before.
- During the year to 31 March 2020, the Company’s investment and capital expenditure totalled of GBP 1,357.4 million (excluding SSE Energy Services and Gas Production), which includes GBP 1,036.6 million invested in the core businesses of SSE Renewables, SSEN Transmission, and SSEN Distribution.
- Adjusted net debt and hybrid capital stood at GBP 10.5 billion at 31st March 2020, up from GBP 9.4 billion in March 2019.
Share Price Performance Analysis
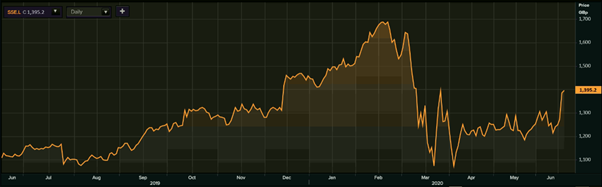
(Source: EODHD/Others, Thomson Reuters) -1-Year Chart as of June 18th, 2020, before the market close
SSE’s shares were quoting at GBX 1,395.20 on 18th June 2020 (before the market close at 2:47 PM GMT+1). Stock's 52 weeks High is GBX 1,703.00 and Low is GBX 1,057.50. Total outstanding M-Cap. (market capitalization) stood at approximately GBP 14.42 billion.
Business Outlook
In the Financial year 2021, the COVID-19 impacts on the operating profit expected in the range of £150-£250 million before mitigation and reducing planned cash outflow by at least GBP 250 million. In five years to 2024/25, SSE plan to invest capital and investment of approximately GBP 7.5 billion. It is targeting a 60 per cent reduction in the carbon intensity of electricity generated by 2030, compared with 2018 levels. The Group maintain net debt/EBITDA ratio at the lower end of a 4.5 to 5 times range from 2021-2025. Also, the long-term focus continues to be on assisting the transition to a net-zero economy, and this is reflected in the substantive growth made in recent months by the core, low-carbon networks, and renewables businesses.
ContourGlobal PLC (LON:GLO) – Maintaining Dividend Policy and Guidance Amid the Pandemic
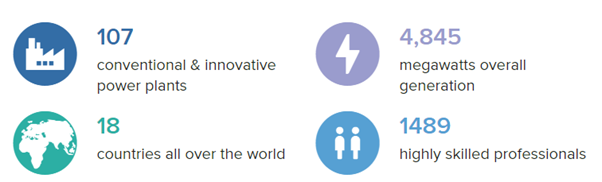
ContourGlobal PLC is a FTSE 250 listed Company, which manages contracted wholesale power generation businesses in 18 countries with nearly 4.8 GW in operation. Its portfolio comprises of 107 renewable and thermal power plants across Latin America, Europe and Africa. The Company is engaged in developing, acquiring, owning and operating wholesale power generation businesses with expertise across wind, solar, hydro and thermal generation. Primarily, it is organised into two divisions: Thermal and Renewable. The Thermal division consists of plants using conventional fuels, specifically natural gas, coal, fuel oil and diesel. The Renewable division consists of plants using renewable resources of wind, solar and hydropower.
(Source: Annual Report, Company Website)
Synopsis of Recent Regulatory Updates
28th May 2020: The Company’s credit rating was from 'BB-' to 'BB', by the S&P Global Ratings. It reflects resilience and stability in the business model of the Company, which continues to maintain financial flexibility.
28th May 2020: The Company affirmed that it is experiencing minimal financial and operation impact from COVID-19. In April 2020, the Company announced its share buy-back programme, and by 28th May 2020, the Company had repurchased 3.5 million shares for GBP 5.5 million in consideration.
Trading Update – Delivered Decent Performance Despite the Challenging Period
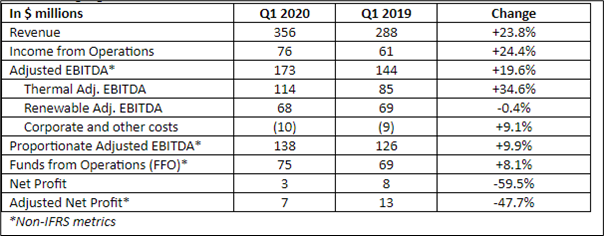
On 15th May 2020, the Company provided a trading update for the period from 1 January 2020 to 31 March 2020, with a decent set of results and confirmed the first-quarter dividend payment of 4.06 cents per share. Some additional highlights that reflects decent operating and financial performance:
- Overall, operational performance stays robust with a 96.3 per cent of average availability factor combined across the renewable and thermal fleets, compared with the corresponding period of the last year (95.9 per cent).
- Adjusted EBITDA increased by 20 per cent to USD 172.7 million from USD 144.4 million, with adjusted EBITDA in the Renewable division of USD 68.0 million was in line with the same period last year.
- The Funds from Operations (FFO) rose by 8 per cent to USD 74.5 million in Q1 FY20 as compared with the corresponding period of the last year. This reflects a robust cash flow generation.
- The cash conversion rate defined as FFO to Adjusted EBITDA continued to be robust at 43.0 per cent in the first quarter of 2020, slightly lower than Q1 FY19.
- In the current quarter, the dividend has improved by 10 per cent, and it reflects the robust and predictable cash flow generation.
- The Company has issued corporate notes, EUR 400 million maturing in 2025 and EUR 450 million maturing in 2023.
(Source: Trading Update, Company Website)
Share Price Performance
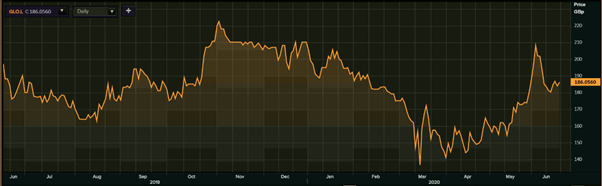
(Source: EODHD/Others, Thomson Reuters) -1-Year Chart as of June 18th, 2020, before the market close
GLO’s shares were quoting at GBX 186.06 on 18th June 2020 (before the market close at 2:50 PM GMT+1). Stock's 52 weeks High is GBX 226.50 and Low is GBX 120.00. Total outstanding M-Cap. (market capitalization) stood at approximately GBP 1.23 billion.
Business Outlook
The Company is continuing to deliver growth and shareholder returns, with anticipated Adjusted EBITDA in the range of $710-$745 million for 2020. Furthermore, the Group seeks to expand through acquisition globally and deliver improved earnings. The Company also maintains its target of a 10 per cent increase in annual dividends per share. GLO has a resilient business model and visible pipeline of future growth, with emphasis on clean technologies and no future investment in coal.
